- Last year, the pound had its strongest performance since 2017, rising 5%.
- Sticky inflation has forced the Bank of England to delay monetary easing compared to its peers.
- Markets expect a 25 basis point cut in the BOE rate as early as May.
This Tuesday, GBP/USD price analysis reveals a subtle bearish undertone, a surprising move after the currency’s stellar 5% rise last year, marking its strongest performance since 2017.
If you are interested in automated Forex trading, check out our detailed guide-
However, the likelihood of another rally this year is low due to the weakening economy and election uncertainty. Notably, inflation has forced the Bank of England to delay monetary easing compared to its peers. Moreover, the dollar fell amid expectations of an early US rate cut.
Last year’s gains position the pound favorably in the expected election year. However, the driving forces behind the rally are losing momentum. One factor is the weakening of the impact of differences in interest rates.
The idea that the Bank of England would lag behind the ECB and the Fed in easing policy initially boosted the pound. However, recent economic data has changed this. In November, UK consumer price inflation eased sharply to 3.9%. At the same time, Britain’s gross domestic product was revised down, revealing a 0.1% contraction in the third quarter.
Accordingly, traders adjusted their expectations, bringing in predictions of the first rate cut by the Bank of England. Currently, markets expect a cut of 25 basis points as early as May, which is a shift from the previous expectation in August.
GBP/USD key events today
No major events are scheduled for the day, making for a quiet trading session. Investors will look forward to key data releases tomorrow.
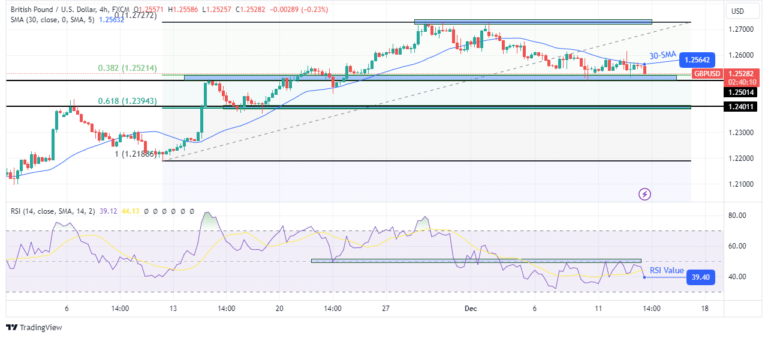
GBP/USD Price Technical Analysis: Bears strengthen as RSI points to possible reversal

The pound is bullish on the charts as the price makes higher highs and lows and respects the support trendline. Furthermore, the price is mostly trading above the 30-SMA with the RSI above 50, supporting the bullish bias. However, this shallow, bullish move stalled near the 1.2800 level.
If you are interested in guaranteed stop loss forex brokers, check out our detailed guide-
Furthermore, the new high is weaker than the previous one, as seen on the RSI. The bearish divergence in the RSI suggests that the bears may soon push the price below the 30-SMA and the support trendline. In addition, the trend could reverse if the price breaks below the key level of 1.2700. However, the bullish bias will remain if the bulls hold the price above the SMA.
Do you want to trade Forex now? Invest in eToro!
67% of retail investor accounts lose money when trading CFDs with this provider. You should consider whether you can afford to take the high risk of losing money.