- The loonie weakened on weak Canadian factory activity.
- Market expectations for a Fed rate cut in 2024 have been reduced.
- Oil prices fell due to interest rate fears and reduced tensions in the Red Sea.
USD/CAD price analysis paints a bullish picture as we head into the trade landscape in 2024. The Canadian dollar’s decline against the dollar continues due to weak Canadian factory activity.
If you are interested in automated Forex trading, check out our detailed guide-
Notably, Canada’s S&P Global Manufacturing Purchasing Managers’ Index worsened on Tuesday, hitting a 43-month low. This reflects the ongoing deterioration of Canada’s economic outlook. At the same time, the manufacturing PMI component in the US fell below expectations. As such, it kept the market’s risk appetite low and supported the dollar due to risk aversion.
In December, the Canadian PMI manufacturing index reached a multi-year low of 45.4, compared to November’s 47.7. Similarly, the US manufacturing PMI for December hit a four-month low of 47.9. It missed the market expectation of a stable November reading of 48.2.
Moreover, construction spending in the US experienced a decline in November and rose 0.4% compared to the market forecast of 0.5%. However, October’s monthly construction spending reports saw a significant late revision from 0.6% to 1.2%.
At the same time, market expectations for a Fed rate cut in 2024 have been reduced. Money markets are now pricing in an average of 150 basis points of rate cuts by the end of the year.
In addition, the currency fell as oil prices fell on interest rate fears and reduced tensions in the Red Sea. Canada is a significant oil exporter. So falling oil prices hurt the Canadian dollar.
USD/CAD Key Events Today
- US ISM manufacturing PMI
- US JOLT is creating new jobs
- FOMC meeting minutes
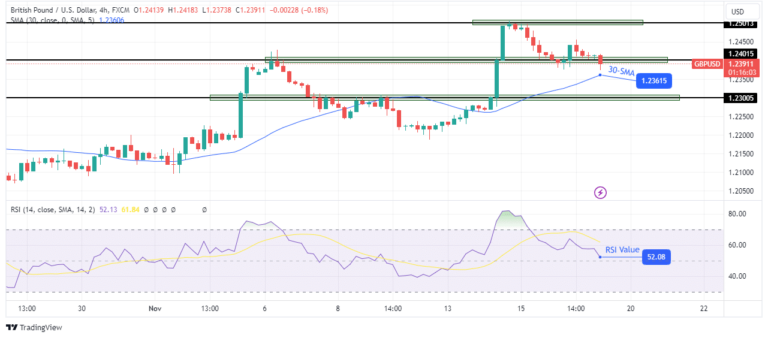
USD/CAD Technical Price Analysis: Bulls recover from support depth at 1.3200

On the technical side, USD/CAD recovered from lows near the key support level of 1.3200. The bias is bullish as the price is well above the 30-SMA and the RSI is almost overbought. The bearish trend reversed when the price became oversold and the bulls pushed the price above the 30-SMA.
If you are interested in guaranteed stop loss forex brokers, check out our detailed guide-
Currently, the bullish move is approaching the key resistance level of 1.3350. Additionally, there is resistance from the 0.382 fib retracement level. This creates a strong resistance zone that can lead to a break in the bullish move. However, if the new bias remains firm, the price will only pull back before breaking above the resistance to continue the uptrend.
Do you want to trade Forex now? Invest in eToro!
67% of retail investor accounts lose money when trading CFDs with this provider. You should consider whether you can afford to take the high risk of losing money.