- A new higher high activates further growth.
- A break of 2,041 signals a deeper decline.
- US data could change the mood.
The gold price hit a new multi-day high of $2,050 yesterday amid a weaker US dollar. Now the metal has pulled back a bit and is trading at $2,045 at the time of writing.
–Are you interested in learning more about automated Forex trading? Check out our detailed guide-
Bias remains bullish despite corrective downside. After yesterday’s strong rally, the price is pulling back amid profit-taking.
US jobless claims came in at 215k above expectations of 209k, the core PCE price index rose 0.4% as expected, personal income rose 0.1%, versus an estimate of 0.4% growth , while personal consumption was in line with expectations.
Moreover, Chicago PMI and pending home sales are worse than expected. Still, the dollar strengthened despite mixed economic numbers. The rise in KSAU/USD was somewhat expected after some poor numbers.
Today, China’s manufacturing PMI came in at 49.1 points as expected, the non-manufacturing PMI jumped from 50.7 points to 51.4 points, above the 50.9 point forecast, while the Caikin Manufacturing PMI was reported at 50.9 points, above 50.7 percent. A flash estimate of Eurozone CPI and a flash estimate of core CPI should also have an impact later.
However, only economic data from the US could change the mood. ISM Manufacturing PMI and Revised UoM Consumer Sentiment are high-impact events.
In addition, data on ISM production price, construction costs, UoM’s revised inflation expectations and total department vehicle sales will be released.
Technical analysis of the price of gold: correction of gains
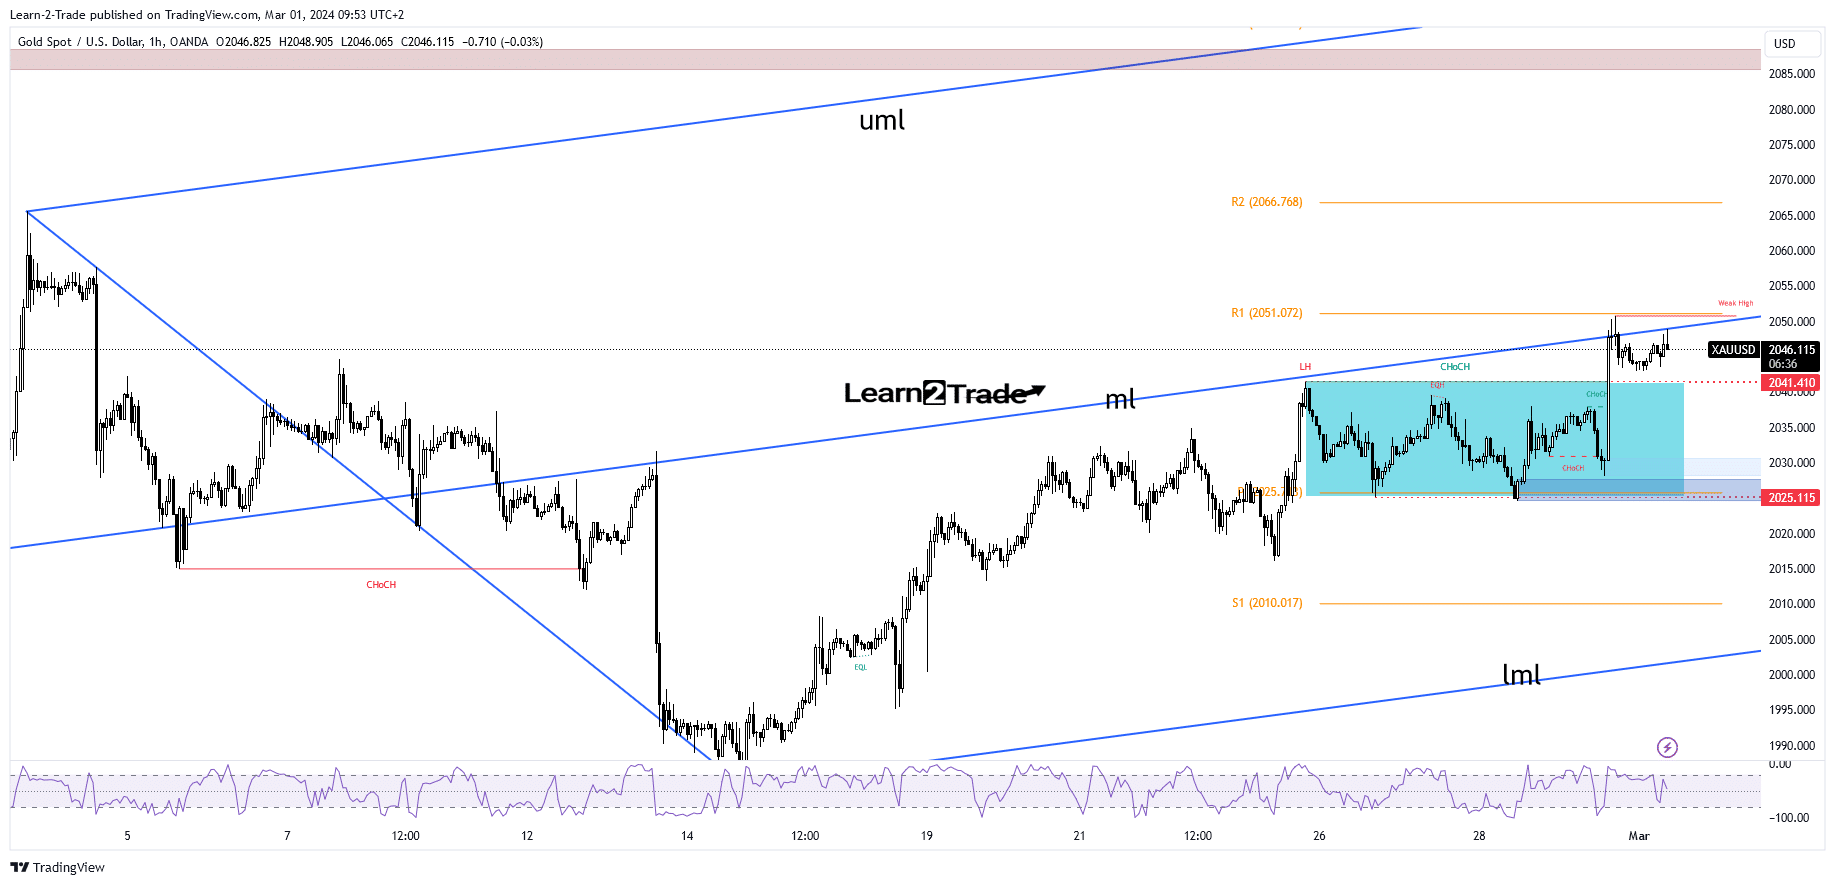
Technically, KSAU/USD found resistance just below the R1 of $2,051. It only printed false breakouts through the midline (ml) and has now turned to the downside after retesting dynamic resistance.
–Are you interested in learning more about forex signals? Check out our detailed guide-
The first lower target and obstacle is the $2,041 level. A pullback is natural after the last bullish momentum. Price could try to confirm breakouts from the range move.
A decline and a close below $2,041 could lead to more declines. A continuation to the upside should be confirmed by a new higher high if the price bounces and closes above the midline (ml) and R1 (2.051).
Do you want to trade Forex now? Invest in eToro!
67% of retail investor accounts lose money when trading CFDs with this provider. You should consider whether you can afford to take the high risk of losing money.