- Oil prices fell nearly 1 percent on Monday amid talks about a ceasefire in the Middle East war.
- Canadian wholesale trade fell 1.3% in March.
- US data shows a moderate increase in inflation in March.
The USD/CAD outlook shows a slight bullish trend, with the Canadian dollar weakening in response to lower oil prices. At the same time, recent data from Canada and the US reinforced expectations that the Bank of Canada will cut in June, while the Fed remains hawkish.
–Are you interested in learning more about crypto signals? Check out our detailed guide-
Oil prices fell nearly 1 percent on Monday amid talks about a ceasefire in the Middle East war. As a result, investors were less worried about an escalating war and a tighter oil market. Falling oil prices usually lead to a fall in the loonie, as Canada mainly exports the commodity.
Meanwhile, data on Friday revealed that Canadian wholesale trade fell 1.3% in March from the previous month. This was another indication of the slowdown in the Canadian economy. That puts more pressure on the Bank of Canada to cut rates by June.
On the other hand, US data shows a moderate increase in inflation in March. However, housing and utility costs remained high, indicating continued price pressures. Since the start of the year, US inflation data has continued to surprise markets, leading to a decline in Fed rate cut expectations. Moreover, the outlook is constantly changing with incoming data, making the Fed more hawkish than the Bank of Canada. As a result, the Canadian dollar has lost value against the US dollar since the beginning of the year.
USD/CAD Key Events Today
The pair could consolidate as there are no key economic releases from Canada or the US today.
USD/CAD Technical Outlook: Bears weaken near 0.618 Fib
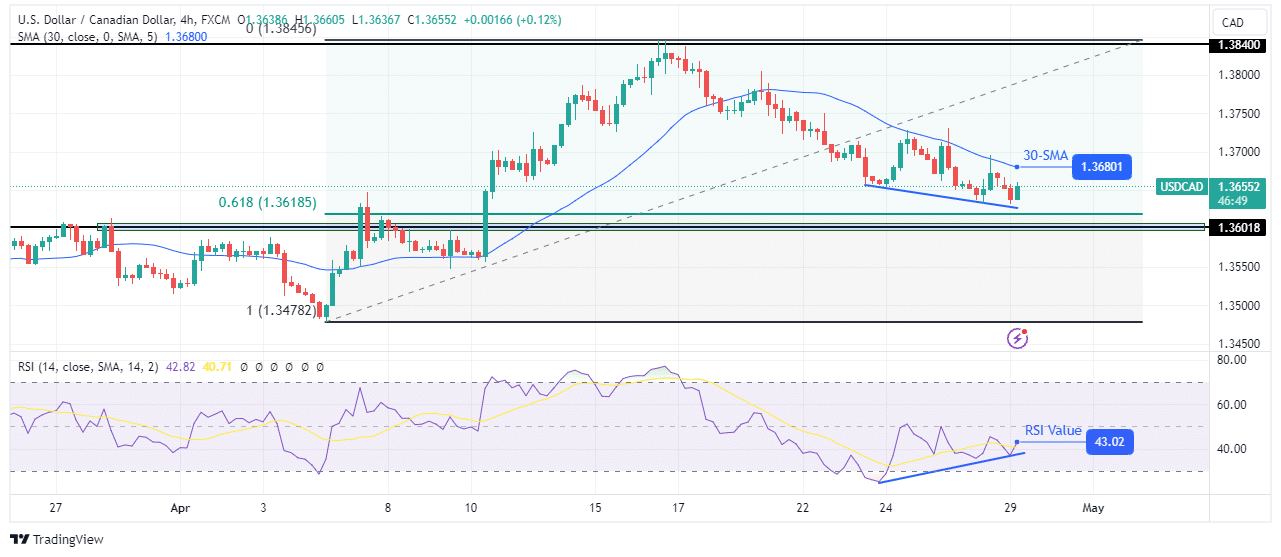
On the technical side, the USD/CAD price is in a downtrend as it is trading below the 30-SMA with the RSI in bearish territory. However, although the price respects the SMA as resistance, it has started trading near the line. Because of this, it is more difficult for bears to make large swings below the SMA. This is a sign that they are weaker. This weakness is approaching the 0.618 Fib level, which could act as support.
–Are you interested in learning more about Forex robots? Check out our detailed guide-
At the same time, the RSI made a bullish divergence, indicating weaker bearish momentum. If this divergence plays out, the price could break above the SMA and target the 1.3840 resistance level.
Do you want to trade Forex now? Invest in eToro!
67% of retail investor accounts lose money when trading CFDs with this provider. You should consider whether you can afford to take the high risk of losing money.