- The data revealed that July wholesale inflation in the US was softer than expected.
- The headline US CPI number eased to 2.9% from 3.0%.
- The dollar got a brief respite as retail sales jumped 1.0%.
The weekly USD/CAD forecast is falling due to growing confidence in the Fed’s quarter-point rate cut in September.
USD/CAD Ups and Downs
The USD/CAD pair had a bearish week, with US data as the primary catalyst. Most of the US economic reports weighed on the dollar during the week, strengthening the Canadian dollar. As the week began, data revealed July US wholesale inflation was softer than expected.
-Are you interested in learning more about the Forex Signal Telegram Group? Click here for details –
Meanwhile, headline CPI eased to 2.9% from 3.0%. Accordingly, investors have increased the likelihood of a Fed rate cut in September. However, the dollar got a brief respite as retail sales jumped 1.0%. Still, expectations of a Fed rate cut kept a lid on gains.
Next week’s key events for USD/CAD
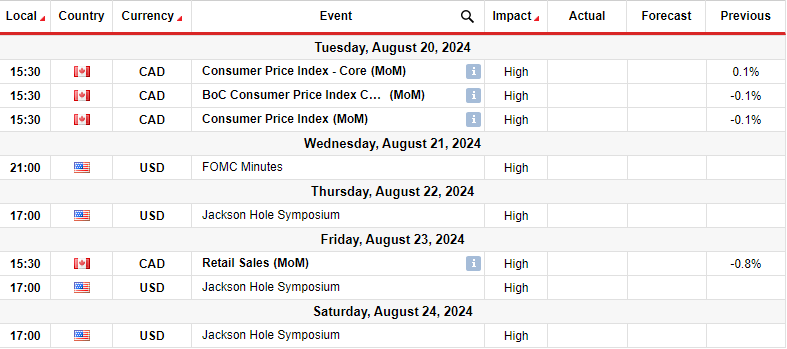
Next week, traders will pay attention to Canadian inflation and retail sales data. Meanwhile, the US will release the minutes of the FOMC meeting. At the same time, investors will pay close attention to Powell’s speeches at the Jackson Hole Symposium.
Canada’s CPI fell 0.1% in the previous month. Inflation in the country has declined in recent months, giving policymakers the confidence to cut interest rates. At the same time, the Canadian economy has slowed down, especially in the labor market.
Accordingly, investors expect the Bank of Canada to cut rates in September. Another cooler inflation report will support these expectations. Meanwhile, the FOMC minutes may hold clues about the Fed’s next move. Moreover, Powell’s speeches will show whether the central bank is ready to cut in September.
USD/CAD Weekly Technical Forecast: Bears reach 1.3700 barrier

On the technical side, the USD/CAD price is trading below the 22-SMA with the RSI below 50, indicating a bearish bias. The trend recently reversed when the price reached the resistance level of 1.3900. The bears took control pushing the price below the 30-SMA. However, the decline was stopped at the 1.3700 support.
-If you are interested in Forex day trading, please read our getting started guide-
Here, the bulls could re-emerge to retest the recently broken 22-SMA before the downtrend continues. A break below the support at 1.3700 will allow the bears to reach the level of 1.3601. Moreover, the price would make a lower low, confirming the downtrend. On the other hand, if the SMA fails to hold the resistance, the price will climb to the resistance at 1.3900.
Do you want to trade Forex now? Invest in eToro!
67% of retail investor accounts lose money when trading CFDs with this provider. You should consider whether you can afford to take the high risk of losing money.