- Data on Monday revealed a stronger-than-expected 0.7 percent increase in U.S. retail sales.
- Fed policymakers gradually lost confidence in their progress toward reducing inflation.
- Japanese officials are continuing their verbal warnings of a major currency drop.
USD/JPI price analysis is fueled by bullish sentiment, reaching a 34-year high amid poor market sentiment. The dollar’s rise, led by upbeat US data, boosted the yen’s decline, leading to investor war on possible Japanese intervention.
-Are you looking for the best AI trading brokers? Check out our detailed guide-
Data on Monday revealed a stronger-than-expected 0.7 percent increase in U.S. retail sales. This was the third consecutive positive key report, pointing to a resilient economy. Furthermore, the retail sales report is a leading indicator of consumer spending. If consumers still have a lot of money to spend, it’s a sign that the economy is doing well. That, in turn, could lead to a spike in inflation, which remains above the Fed’s 2% target. Therefore, the Fed will most likely delay rate cuts.
Moreover, policymakers gradually lost confidence in the progress made in reducing inflation. Accordingly, most have taken a hawkish stance, urging patience on rate cuts. As a result, markets expect the first rate cut in September. At the same time, this year they expect less than 45 basis points in the overall rate reduction. This change in outlook sent dollar and Treasury yields to new highs, putting downward pressure on the yen.
Japanese officials are continuing their verbal warnings of a major currency drop. However, this had little effect as USD/JPI broke above $154. With the $155 level looming large, markets expect an intervention. Such an outcome could strengthen the yen for some time.
USD/JPI Key Events Today
USD/JPI Technical Price Analysis: Cautious bullish move signals reversal


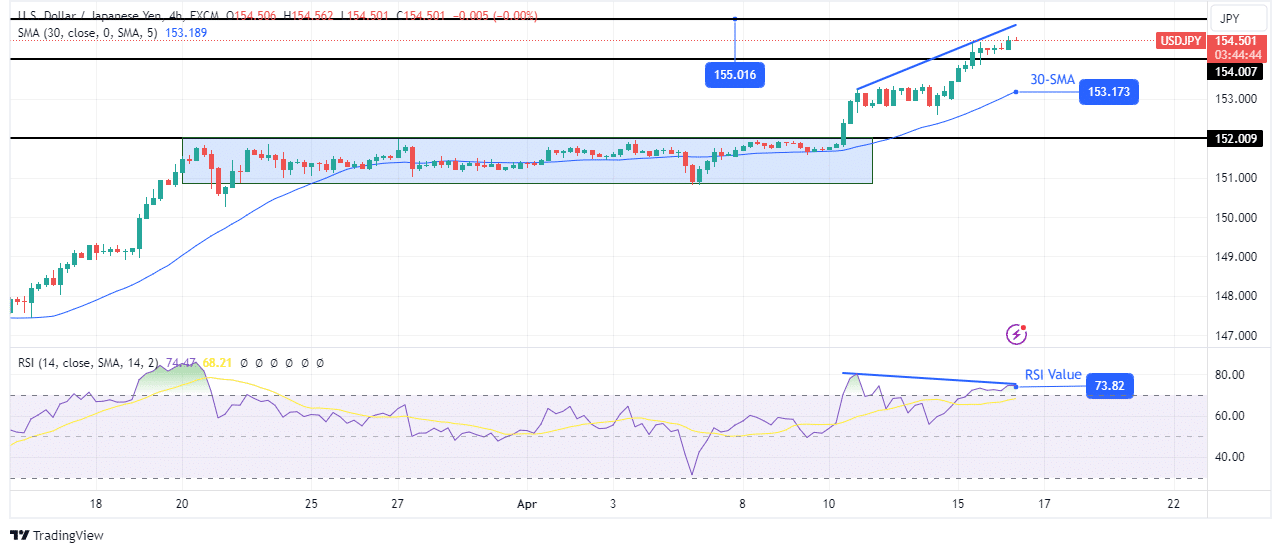
On the charts, the USD/JPI price broke above the key resistance level of 154.00 to make a new high. So the price is in a bullish trend. However, while the price has a higher high, the RSI has a lower one, showing a divergence.
-Are you looking for the best MT5 brokers? Check out our detailed guide-
The Bulls are ahead, but the momentum is waning. However, if the bulls maintain control, the price will soon retest the 155.01 resistance level. On the other hand, if the divergence shows up, the bears will make a strong move to retest the 30-SMA or break below. Meanwhile, the divergence will recede as the bull trend continues unless the bears are ready to reverse the trend.
Do you want to trade Forex now? Invest in eToro!
75% of retail investor accounts lose money when trading CFDs with this provider. You should consider whether you can afford to take the high risk of losing money.


