- US jobless claims fell more than expected, pointing to solid labor demand.
- US PMI data showed growth in the manufacturing and services sectors.
- Consumer price indices in Tokyo showed inflation falling below the central bank’s 2% target.
The weekly USD/JPI forecast supports further gains as markets anticipate a gradual cycle of Fed rate cuts and a less hawkish BoJ.
USD/JPI ups and downs
The USD/JPI pair had a bullish week as market participants focused on the resilience of the US economy. At the same time, inflation data in Japan eased, reducing expectations for a BoJ rate hike.
–Are you interested in learning more about the UK Trading Platform overview? Check out our detailed guide-
US data during the week showed that jobless claims fell more than expected, pointing to solid demand for labor. Meanwhile, PMI data showed growth in the manufacturing and services sectors. Consequently, there is less pressure on the Fed to reduce borrowing costs.
In Japan, CPI in Tokyo showed inflation falling below the central bank’s 2% target, complicating prospects for a BoJ rate hike and weighing on the yen.
Next week’s key events for USD/JPI
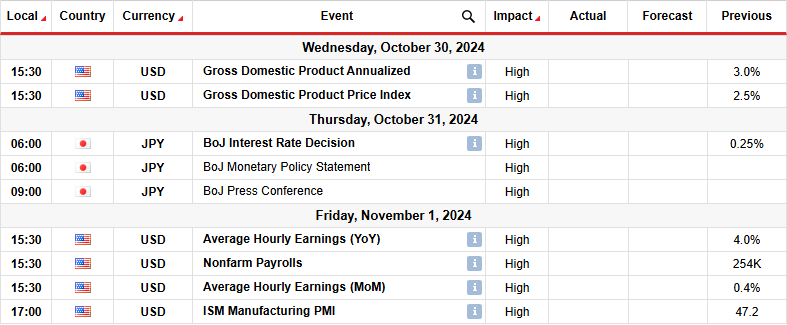
The Bank of Japan will hold a policy meeting next week and is likely to keep rates unchanged. Meanwhile, the US will release data on GDP, monthly employment and manufacturing PMI. The outlook for a rate hike in Japan has changed with a new prime minister and incoming economic data. Ishiba noted that the economy is not ready for more rate hikes. Meanwhile, inflation data shows weak spending, further casting doubt on the outlook.
On the other hand, the US economy remained resilient to strong demand. Therefore, there is a good chance that the NFP report will show strong job growth, reducing bets for a November Fed rate cut.
USD/JPI weekly technical forecast: 0.618 Fib resistance is a challenge

From the technical side, USD/JPY the price started a new bullish trend that stalled near the resistance level of 153.00. The bullish bias is strong as the price has been trading well above the 22-SMA since the bulls took control. At the same time, the RSI remained close to the overbought region, indicating solid bullish momentum.
–Are you interested in learning more about forex signals? Check out our detailed guide-
However, the new bullish trend is facing a solid resistance zone consisting of the 0.618 Fib retracement level and the psychological level of 153.00. Therefore, the price could pause at this level before breaking above or pulling back to retest the SMA support. However, as long as USD/JPI remains above the SMA, it will eventually break through the resistance zone and retest the 158.04 resistance level.
Do you want to trade Forex now? Invest in eToro!
68% of retail investor accounts lose money when trading CFDs with this provider. You should consider whether you can afford to take the high risk of losing money